!!!!!

Science!!!!! :)

Monday, December 12, 2011

Science Essay: Acid Rain

          Acid rain is yet another form of pollution.  Caused by burning coal, driving cars, erupting volcanoes, and other means – both natural and man-made, acid rain can cause serious harm to the animals and people around it.  Acid rain is caused by an excess of nitric and sulfuric acids in the atmosphere.  When it falls down in the form of rain, or is combined with dust, it affects the environment around it in negative ways.  When you add acid to ponds and lakes, aquatic life is put into danger.  Fish die out and those that eat them must starve.  When acid lands in soil, many plants cannot survive, and herbivores do not have enough food.  The effects of acid rain snowball out of control, like a wave of dominoes.  Acid rain can destroy a whole way of living for the animals living in one area.  However, many scientists are trying to figure out ways of preventing this big problem.  Acid rain is an issue we must all try to change. 
When gasses such as carbon dioxide, carbon monoxide, and substances like lead and other air pollutants are released into the atmosphere, acid rain is produced.  Acid rain is the product of this pollution: an excess of nitric and sulfuric acids is spread over large areas of land through rain (in wet places) and dust (in dry places).  There are many reasons why acid rain is caused – both man-made and natural.  Erupting volcanoes and rotting plants can cause the toxic gasses to go up into the atmosphere, but the majority of acid rain is caused by humans.  When we drive cars and ride in planes and trains and boats, we release carbon dioxide and other dangerous substances into the air.  Acid rain can fall in two categories: wet deposition and dry deposition.  Wet deposition occurs when acidic chemicals are blown into wet areas, which results in acidic water.  Dry deposition happens in very dry areas, where there isn’t very much rain.  The acid chemicals end up being distributed in dust and dirt, instead of water.  Both of these ways of releasing acid rain into the environment are very harmful for people and animals. 
            Acid rain can affect both humans and animals, but it is most dangerous towards aquatic life.  As acidic water flows downhill, it deposits aluminum in nearby streams, rivers, and lakes.  When it settles in a lake, the pH of that lake goes down, becoming more and more acidic.  This means that even as more acid is being added to underwater ecosystems, toxic aluminum is being deposited there as well.  Many fish and other marine animals cannot survive in areas of low pH.  At a pH of five, most fish eggs will find it impossible to hatch, and at any pH lower than five, many more adult fish will die.  Some animals, such as frogs, have developed a tolerance toward acid.  However, the insects they depend on for food may not be able to withstand water with a low pH.  So even if a particular species can survive in acidic conditions, the prey they catch cannot, so they will die anyway.  Not only is the livelihood of frogs and fish damaged, but birds are affected, too.  Snails find it difficult to survive in areas of high acidity, because they depend on calcium found in soil.  Much of this mineral is lost when it is replaced by acid.  If snails don’t find enough calcium in their habitat, they cannot survive, and die out.  This causes a problem for the birds.  Snails are a high source of calcium, and eating them helps birds to lay strong eggs.  When there aren’t enough snails for birds to eat, then the eggs, the birds can’t get enough calcium in their systems, and they are forced to lay eggs with very thin shells.  Many eggs are unable to hatch because of shell breakage and other accidents.  If the population of birds is depleted, then there is less food for predators who depend on birds to eat.  This, in turn, affects the carnivore population.  It is one big chain reaction. 
            There are many good things being done to help reduce the amount of acid rain produced by factories and cars.   According to the website epa.gov, instruments such as catalytic converters help reduce the amount of harmful gasses released into the atmosphere when we drive.  Also, “scrubbers” are used to reduce the amount of nitric acids that escape from factory smokestacks.  Not only can we try to reduce the amount of nitric and sulfuric acids we produce, but we can also attempt to prevent them from reaching the air.  We can do this by using alternative energy sources such as solar, wind, and hydroelectric power.  These are examples of “green” energy sources, and they have very minimal negative impacts on the environment.
            Acid rain is a serious issue that we all need to be aware about.  It is an overdose of nitric and sulfuric acids in the atmosphere that become absorbed into the natural environment.  It is caused by cars, factories, and other sources that produce exhaust.  Acid rain affects the natural habitats of animals and people around it in very negative ways, and can damage a whole way of living in an ecosystem.  Fortunately, scientists are learning how they can help prevent the spread of acid rain, and, in doing so, help our environment.  

Works Cited
“Acid Rain.” Protecting the Home we Live in:  Environmental Issues. Novi Meadows Elementary, 2002. Web. 28 Nov. 2011. <http://library.thinkquest.org/‌CR0215471/‌acid_rain.htm>.
“Acid Rain.” US Environmental Protection Agency. US EPA, 24 Mar. 2011. Web. 28 Nov. 2011. <http://www.epa.gov/‌acidrain/‌index.html>.
“Acid Rain/‌Prevention.” PB Works. PB Works, 2007. Web. 6 Dec. 2011. <http://acidrain.pbworks.com/‌w/‌page/‌1319114/‌Prevention>.


Tuesday, November 22, 2011

Burning Paper Lab

Science Paper Lab

Research Question:  How does changing the state of paper affect how fast it burns?

Background Information:  The reaction we are creating is a chemical reaction involving turning paper into ash.  This cannot be reversed, so it is a chemical reaction.  

Hypothesis:
Riena:  I think that if we use paper that has been wet and then dried, it will burn the longest.  This is because remnants of water may still remain in paper.  The more wet a piece of paper is, the longer it will take to burn.  

Variables:
    -Independent Variable:  This is the variable that we change.  In this experiment, it will be the state of the paper we burn that is the dependent variable.
    -Dependent Variable:  This is the variable that is the response of what happens to the independent variable.  In this case, the dependent variable is the time it takes for each paper to burn.  
    -Controlled Variable:  The controlled variable is one that stays the same throughout the experiment. It does not change and is not allowed to change unpredictably.

Safety Cautions:
-While burning the paper, make sure that you burn it in a fire-safe container
-Be careful that none of the fire escapes from the container
-Do not let anyone touch the paper while  it is burning
-Do not get too close to the paper while it is burning
-You may want to wear goggles to protect your eyes, although these are not vital to the experiment

List of Materials:
-Four sheets of A4 paper
-Matches
-Something to burn the paper in
-Writing Materials
-Stopwatch

Procedure:
1.) Burn a regular piece of paper
2.) Record observations*
3.) Crumple up that piece of paper the same size as the first, and burn it
4.) Record observations
5.) Wet another piece of paper, let it dry, crumple it up, and burn it.
6.) Record observations
7.) Wet another paper, let it dry, and then burn it.
8.) Record observations

*Fill out all observations in data table below


Data Table:
State of Paper:Time it Takes to Burn (seconds): Other Observations:
Regular 78Had to re-light
Wet and Dried 31Much wind
Crumpled 67
Crumpled, Wet and Dried 105

Graph


Conclusion: 
          My hypothesis was correct.  The "crumpled, wet and dried" paper took the longest to burn by a long shot.  As you can see in both the graph and table above, the paper that we soaked in water, dried, and crumpled up took 105 seconds to burn, whereas the paper that burned the second slowest took 78 seconds to burn.  The "wet and dried" paper might also have taken a longer time to burn, but while we were burning it, a gust of wind hit us.  This meant that there was more oxygen, and therefore more fuel, which meant that the paper burned more quickly. 

Further Inquiry:
          While we were conducting the experiment, many things went wrong.  There was an inconsistent amount of wind, and we had to re-light some of the papers.  The amount of wind in an experiment matters because wind affects how much oxygen is present.  Oxygen fuels fire: the more oxygen, the greater the fire.  Also, too much wind will blow out a small fire, and then we have to re-light the paper.  One of the fires went out, so we had to relight the paper, which took time.  This would have made us collect incorrect data.  If we were to do this experiment again, we should light our papers on a wind-less day.  This means we would not have wind, and our experiment would be unaffected.  If we wanted to collect even more information, we could measure the mass of each paper before and after we soaked them in water and dried them.  If we did that, we could see if paper gains mass after being soaked in water. 

Monday, November 7, 2011

Color Experiment

         In science class, we conducted a lab to figure out whether or not food coloring from skittles was polar or non-polar, and whether or not food coloring has more than one color in it at a time.  The way we did this was we dropped some water on different colored skittles to get the color out.  Then, we dabbed the color onto coffee filter paper.  After that, we put the paper in water.  Water traveled up the paper, and the idea was to see if the colors would travel up, too.  Since water is polar, and polar substances wash polar substances, if the colors rose, then they would be polar.  The coffee filter paper is non-polar, and since non-polar sticks to non-polar, we knew that if the color stayed, it was non-polar.  Also, if there were many different colors in one dye, they should have risen so that there was one color on top of another.  As you can see in the picture above, the experiment was done properly, and you can see that there are multiple colors.  The colors that rise the most, will be the most polar, as they will have traveled the furthest with the water.  The colors at the bottom near their dots are not as polar, because they have not followed the water up so far. 
As you can see in the picture to the left, we started out by putting the color on the dots.  However, we could not get enough dye to go on, or it was too diluted by water, so the colors are not very clear. 

In the photo to the right, you can see that the water traveled up the paper, but there is not very much color visible that has traveled up from the dots.  We did this experiment wrong, because we didn't put enough color on the paper, so it kind of failed.  We can't see anything going up the paper.  If we were to try this lab again, we should add more skittle dye to the paper, and we might want to use white paper instead of brown so that the color would show more. 

Tuesday, October 25, 2011

Candy Molecules

 During science today, we made molecules out of candy.  Different candies were used to represent different atoms. 


1.)  The first molecule we made was sodium chloride (NaCl).  As you can see, the gummy circle is sodium, and the big chocolate marshmallow is chlorine.  All the x's around the chlorine atom represent its seven electrons, and the little dot by the sodium atom represents its one electron.  They are sharing sodium's electron, because if chlorine gains one more electron, it becomes stable, which is what all molecules want to become. 


2.)  The second molecule we made was water, or H2O.  The pink candy represents the oxygen atom, and the two gummy circles represent the hydrogen atoms.  The x's are the hydrogen atoms' electrons, and the dots are the oxygen's electrons.  As you can see, both hydrogens are sharing their electrons with oxygen, so oxygen has the use of eight electrons.  Therefore, it is stable.  


3.)  The third molecule we made was carbon dioxide or  CO2.  The big chocolate marshmallow in the center of the molecule is a carbon atom, and the two gummy circles represent oxygen atoms.  As you can see, the carbon atom is sharing two of its electrons with each of the oxygen atoms, and each of the oxygen atoms are sharing two of their electrons with the big carbon atom.  This means that each atom has a total of eight electrons each.  They are all stable, and they are all "happy". 


4.)  The last molecule we made was CH4.  The picture doesn't show it, but there were really four gummy bears surrounding the Turkish Delight, not three.  Each gummy bear represented one hydrogen atom, and the Turkish Delight represented the carbon atom.  We drew the diagram incorrectly.  Correctly drawn, all the hydrogen atoms would have only one electron, which they would be sharing with the carbon atom.  That way, the carbon atom, which already has four electrons, will end up having eight - one more from each of the four electrons.  However, each hydrogen atom has five electrons, so just ignore that and pretend that they each only have one. 

Sunday, October 23, 2011

Current Events: New Zealand Oil Spill

Dead Seabird - Killed by the Oil
        There has been a massive oil spill in the sea around New Zealand recently.  Over 50 tons of oil has been released into the sea, and so far, only 10 tons have been removed.  Over 300 Defense Force personnel are working on getting rid of the oil, as well as specialists from Australia, the Netherlands, and the UK.  This oil spill is a big threat to the local oceanic wildlife of New Zealand.  Birds that depend on water for food, like penguins, swim through the oil and get it all over their feathers.  When they preen, they could get the oil into their system, and there is also a large risk that they will contaminate their chicks with it.  Birds like petrels, which don't swim in the water, but dive down to catch fish, will also be affected.  When they get oil in their feathers, it makes it harder for them to fly.  Orca whales, bottlenose dolphins, baleen whales, and beaked whales are also threatened as oil spills into their migratory routes.  Some animals, which are already endangered, are in the most danger from this oil spill.  If too many of them are wiped out, they may become extinct.  There are several volunteer groups working very hard at protecting and cleaning the animals that are being affected by the oil, but they can only do so much.

For more information, go to:  Oil Spill

Thursday, October 6, 2011

Making an Atom

          During class, I made a scale model of a sodium atom.  The scale was 250 picometers/cm.  The only things that were not modeled to scale were the electrons.  Electrons are supposed to be 2000 times smaller than a proton or neutron, but the electrons I made were probably only about 100 times smaller.  There is a picture of my atom to the right.  As you can see, the neutrons and protons are showed separately in different shades of green, and the electrons are laid out in levels like a Bohr model. 

Monday, October 3, 2011

Current Events: Gold May be a Bad Investment

          According to CNN, investing in gold may be a bad idea.  All over the world, people believe that gold will always have the same price, even if the cost of everything else collapses.  This is because of the value we have for it.  In the past decade, the price of gold has risen by 600%, even though the global demand for gold has gone down by 18% since 2004.  Many people consider gold as something to invest in, not something to actually use, which is why the price of it has gone up, but the demand for it has gone down.  Also, gold has become much more accessible.  You can now buy gold more easily than you can buy stocks and shares, and in some countries, you can actually obtain this metal from dispensers like ATMs.  According to the article, this is very strange, and the fact that everyone is using gold is more psychological rather than reasonable.  Everyone is so attracted to gold, and that is why it is so expensive.  Once gold goes out of fashion, the gold market will collapse.  So, contrary to what you might think, investing in gold may not be the brightest idea ever. 

For more information, go to:  Gold Investments

Wednesday, September 28, 2011

Relationships Among Elements

1.)  Look at the shape of your graph.  Wat patterns do you observe?
           I observe that it starts out high, then makes a major drop, then goes up higher than before, and slides back down.  Then, the line goes even higher than before, and again, it goes back down.

2.)  What family is represented by the high peaks in your graph?
          The alkaline metal family is represented by the peaks in my graph. 

3.)  What family is represented by the low points in your graph?  
          Group 17 (fluorine, chlorine, etc) is represented by the low points of the graph.


4.)  What family is represented by the smaller peaks just before the high peaks in your graph?
         The noble gasses are represented by the smaller peaks.


5.)  What trends do you notice about the radii of the elements at the high peaks as you move from left to right on your graph?  Look at your periodic table and find the element that represents each peak.  What does each high peak begin in the periodic table?  
          The radii of the elements at the high peaks grow bigger.  Each high peak represents a new period.  The first peak represents sodium, the second one potassium, the third rubidium, and it goes on down the alkaline metal family.  On the periodic table, all of these elements are on the column in the far right.  They all start new periods.


6.)  What happens to the radii of the elements between the two highest peaks? What does each of these groups of elements represent?
         The radii of the elements in between the two highest peaks get smaller one at a time.  They go 126, 125, 124, 123, 122, 121, etc.  Each of these groups of elements represents a new column. 

Going Further:
How can a graph such as the one you made help to predict the properties of elements that have not been discovered yet?  How reliable do you think this would be?  Explain.
          A graph such as the one I made can help you predict the properties of elements that have not been discovered yet because it follows a pattern.  When graphs follows patterns, you can predict things.  My graph repeatedly goes up and down and up down.  This means it will probably continue rising and dropping, so we can predict that un-discovered elements will have atomic radiuses that are either higher or lower, depending on where they are in the periodic table.  This would be semi-reliable, but you wouldn't be able to use a graph like this for exact precision.  Although the graph consistently follows a pattern, it does have unpredictable numbers.  If you wanted to estimate around how large the atomic radius of an unknown element was, you could do it, but if you wanted exact answers, you would have a very hard time doing it with just a graph. 

Discover:
How do the radii of metals in each period compare to the radii of nonmetals in the period? 
          The radii of metals in each period are much larger than those of the nonmetals in the same period.  For example, sodium and magnesium (metals) have radii of 186 and 127 picometers, whereas sulfur and chlorine (nonmetals) only have radii of 103 and 91 picometers.


Sunday, September 18, 2011

Current Events: LREE found in Afghanistan

          According to American geologists, there could be around 1 million metric tons of LREE in the Khanneshin carbonatite found in Afghanistan. LREE is the acronym for "light rare earth elements."  Elements such as cerium, lanthanum, neodymium, are all very rare, and mining for and selling these minerals could help Afghanistan's economy.  Also, there is an estimate that 1.5 million metric tonnes of REE (rare earth element) may also be found in southern Afghanistan.  Contrary to the name, rare earth elements aren't actually that rare.  Some of them are quite abundant in the Earth's crust.  However, it is difficult to find any deposits of REE large enough to extract from the earth without spending too much money.  REE are becoming increasingly important materials when making things such as batteries and high-strength magnets.  REE are also essential ingredients for us to make "green" alternative energy sources.  We need REE to create electric cars, wind power, and solar cells.  These huge deposits of LREE and REE could give Afghanistan an economically bright future.

For more information, go to: Elements in Afghanistan

Sunday, September 4, 2011

Current Events - Mining in Mongolia

Copper Ore
          There is a huge mining operation currently going on in the Gobi Desert on "Oyu Togoi" which means "Turquoise Hill."  They are finding tons of copper and gold in the Desert.  It is estimated that that mine will produce around 300,000 ounces of gold and 450,000 tons of copper, and will probably end up being one-third of "the nation's total economic output."  Apparently, there is so much metal down there that the company will be busy for at 50 years or more.  The average amount of pay for Mongolia will increase by around 50%.  However, although the mining is doing so much good for the country, it is proving difficult for the local nomads to live their lives.  Some people are afraid that the mining will use up all the water in the ground, and others are frustrated because there is a limited amount of space where they can graze their herds.  Yet other nomadic herders believe that the mine is a good opportunity for making money.  If they can work at the mine and herd their animals, their children will have better chances to go to school and live better lives.
Gold
          I think that this mining company is doing a pretty good job of making Mongolia money and creating jobs for people who would otherwise be unable to support themselves.  The local people know that they need jobs, and even though it can be hard for the herders, I think that overall, the mines will benefit the country and its people more than it will hurt them. 

For more information, go to:  Mining in Mongolia

Monday, August 29, 2011

Discovering which Substance is which

          During this lab, my group was given three cubes (all different elements/compounds), and we had to discover what they were made of using the mass, length, width, and height of the cubes.  To figure out what kinds of materials we had, we needed to figure out the density of each cube.  The density of something is the mass of the object divided by its volume (D = m/V).  That meant that we had to work out the volume of each cube.  Luckily each cube was exactly the same size, and since volume is length times width times height (L*W*H), all we had to do was measure one side of each cube and cube it.  All the sides of each cube were 2.5 cm long, so we cubed 2.5 cm and got a volume for each as 15.625 cm cubed.  We then measured the mass of each cube and divided them by 15.625 to get their densities.  Here are our results:
  • Cube I:   0.6976 g/cm cubed
  • Cube II: 0.9664 g/cm cubed
  • Cube III: 1.504 g/cm cubed
Then, we looked at our charts and, according to density, Cube I was made of oak; Cube II was Polypropylene; Cube III was PVC.  
PVC
Oak


Polypropylene
          Of course, there were many places where we could have made mistakes.  There could have been flaws in the cubes themselves.  There might have been mistakes in the Balance we used to measure the mass of the cubes.  The rulers we needed to measure the sides of the cubes could have been incorrect.  We could have done something wrong.  This means that the results above are not completely accurate.  There are probably errors that have altered the numbers above.  In order to fix this, we could make sure the Balance and rulers are as accurate as possible.  We still would not be able to get everything completely right, but we could get pretty close. 

8th Grade

I am now in the eighth grade and everything I post will be about the cool things I learn this year!

Friday, June 10, 2011

Crater Lab

Guiding Question:  What are the factors that affect the appearance of impact craters? How do scientists use craters to tell the relative age of them?

Hypothesis:  I think that the factors that would affect the appearance of craters would be the force/speed with which the meteorite hit the surface and its mass.  If a meteor is very small and has no mass, it probably won't make a very large impact on the surface of the moon.  If the meteorite does not hit the surface with very much force, it probably won't make that big of an impact, either.  (Compared to other meteorites, of course.)


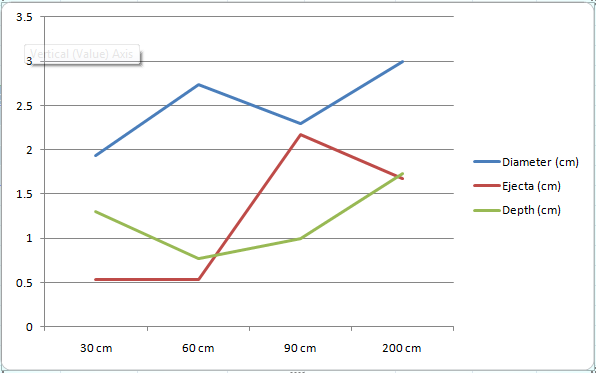
Here is my data table with all the averages of the diameter of the crater, the length of its ejecta, and the depth of the crater:
Here are two different graphs with that information:

Data Analysis:
          I think that the higher the "meteor" was from our flour, the bigger and better the craters became.  Our diameters went up and down a few times, but in the end, they showed that the higher the meteor, the bigger the impact.  My graphs prove that the average height, diameter, and ejecta lengths became larger and deeper.  None of them really consistently go up, but all of them are larger on the 200 cm drop than the 30 cm drop. 

Conclusion:
         I think that I can now answer the question, "What are the factors that impact craters?"  The answer is the size of the meteor and how far away it is from the object it hits.  If you think about it, my hypothesis was partially correct - I thought that the speed and force with which the meteorite hits the surface would determine the size/shape of the crater.  The higher/farther away the meteor is in the first place, the more speed it will gather while traveling through space, and the more force it will have obtained by the time it hits the surface of the moon or some other planet.
 

Tuesday, May 31, 2011

The Endeavor is Going on its Last Flight

The Space Shuttle Endeavor
         One of NASA's most recently constructed space shuttles, the Endeavor, is going on its last flight in early July.  The Endeavor has gone on 24 trips so far, and has covered over 110 million miles of space.  Fortunately, all flights on this space shuttle have been executed perfectly, and there is very little chance that something will go wrong now.  Right now, Endeavor is up in the air and NASA has two chances to land it in Florida this Wednesday.  If they miss the first one, the second opening will be at 4:11 AM.  If there is a problem with the weather, or if there are kinks in the mechanisms of the Endeavor, the crew may be forced to land in California or Mexico, as they may miss the two spots open for landing in Florida. 

If you want to read more information, go to:  Endeavor Article

Wednesday, May 25, 2011

Eclipses


What are the phases of the moon?  What causes them? 
The rotation of the moon around Earth and the Earth around sun causes the phases of the moon.  Different sections of the month reveal the moon to have sun reflecting off different parts of it.

The phases of the moon are:
New moon – The whole moon facing Earth is dark.
Waxing Crescent – After the new moon.  A sliver of light shows.
1st Quarter – Half of the moon is lit up and visible to earth.
Waxing Gibbous – A crescent/sliver of the moon is dark and the rest is light.
Full Moon – The whole moon is bright.  None of it is dark.
Waning Gibbous – A sliver of the moon is dark (on the opposite side of a waxing gibbous)
3rd Quarter – Half of the moon is dark (on the opposite side of the 1st Quarter)
Waning Crescent – Most of the moon is dark (opposite side of a waxing crescent)

What are the dangers of viewing an eclipse?
When you look directly at a solar eclipse, it is dangerous because of the corona.  The moon will block the sun itself, but the aura or corona surrounding the sun, as well as radiation, could harm your eyes and even blind you.  When looking at a solar eclipse, you should have the proper equipment so that you can view it without harm.

What causes the TIDES?
The amount of gravitational pull on the moon causes the tides. 

How often do they occur?
They occur every six minutes.

What causes an eclipse?
There are two types of eclipse:  lunar and solar.  A lunar eclipse is caused by the earth blocking the light from the sun from reaching the moon.  Then, the moon cannot reflect light back to earth, making it seem dark.  A solar eclipse is caused by the moon moving in between the earth and the sun.  Since the moon is so much closer to Earth than the sun, it can block the sunlight from reaching Earth.  This will make it seem as if it is night, even if it is the middle of the day.

What is a lunar and solar eclipse?
A lunar eclipse is when the Earth moves between the sun and the moon, causing the moon to go dark.  A solar eclipse is when the moon moves between the sun and the earth, which makes the Earth go dark. 

Which type of eclipse is more common?
A lunar eclipse is more common.

Tuesday, May 17, 2011

The Moon


1.)     What did you notice about the phases of the moon?   
The phases of the moon really don’t look very different from space, but they are quite different when you’re looking at it from Earth.  Since the moon revolves around our planet, we see different reflected parts of it at different times of the month.  Sometimes, we see the section of the moon that is dark to us, other times, we see half of the moon, since half of the light reflected from the sun is visible to us, and other times, we see what appears to be the full moon, because the whole part of the moon visible to us is reflecting sunlight.

2.)    Why do we see different parts o f the moon each night?
We see different parts of the moon each night, because of the way it revolves around our planet.  Sometimes, we see the parts of it that reflect sunlight, and sometimes, we see parts of it that are dark. 

3.)     What is a lunar month?
A lunar month is the time between two full moons. 

Tuesday, May 10, 2011

Reasons for the Seasons


Question:  How does the tilt of Earth’s axis affect the light received by Earth as it revolves around the sun?
Hypothesis:  I think that since the Earth wobbles on its axis, these wobbling might cause parts of the Earth to be closer to the sun than others.  This may cause the seasons.
1.)     When it is winter in the Northern Hemisphere, which areas on Earth get the most concentrated light?  Which areas get the most concentrated light when it is summer in the Northern Hemisphere?

When it is winter in the Northern Hemisphere, the Earth gets the most concentrated light on the Southern Hemisphere, whereas when it is summer in the Northern Hemisphere, it has the most concentrated sunlight.

2.)     Compare your observations on how the light hits the area halfway between the equator and the North Pole during winter and during summer. 

In the summer, the area halfway between the equator during the North Pole is more concentrated than in the winter.

3.)    If the squares projected on the ball from the acetate become larger, what can you infer about the amount of heat distributed in each square?
 
The amount of heat will have become less, because if the square stretches, that means that there is more room for heat in each square.  The more space there is, the less concentrated the heat is, and the cooler each square will be overall.

4.)    According to your observations, which areas on Earth are consistently coolest?  Which areas are consistently warmest?  Why?

Areas in the north and south sections of Earth, such as the north and south poles, are consistently cool.  This is because even when our planet tilts towards the sun, they do not have the highest concentration of sunlight.  This means that they will not be as warm as other parts of the Earth.  Areas that are consistently warmest are those near the Equator, in between the Tropic of Cancer and the Tropic of Capricorn.  This is because since they are in the middle of the planet, the tilting of Earth won’t really affect them.  They will always have a fairly high concentration of sunlight. 

5.)    What time of year will the toothpick’s shadow be longest?  When will the shadow be shortest?

The toothpick’s shadow will be longest when the Earth model is tilted toward the sun, because the there will be the farthest distance from the base of the toothpick to the section of the model that is in shadow.  The toothpick’s shadow will be longest during summer for the northern hemisphere, and shortest in the winter. 

6.)    How are the amounts of heat and light received in a square related to the angle of the sun’s rays?

The amounts of heat and light received in a square relates to the sun’s rays, because since the earth is round, the squares must bend.  Some of them become gooey rectangles.  This means that sunlight must also bend to cover Earth.
 
Conclusion: 

The Earth’s tilting causes the seasons.  This is because since our planet is on an axis, part of it will always be tilted away from the sun.  If the Earth never tilted, either the northern or southern hemisphere might be too cold for human habitation and we wouldn’t have the seasons.  Since this is not true for Earth and our planet tilts so that part of the year, the northern hemisphere is closer to the sun, and another part of the year, the southern hemisphere is closer to the sun, we have the seasons.  My hypothesis was semi-correct.  I think that I guessed what was happening, but I didn't know how to word it correctly.  I said "wobbles," when I think I meant "tilts."